Optimizing Linkerd Metrics in Prometheus

Linkerd is a service mesh solution with an ideology like “do less but do it best.” It has the Viz extension that provides its own dashboard to present a real-time picture, and Grafana with pre-configured dashboards to analyze historical data. All the dashboards use Prometheus as a backend to scrape, keep and query the metrics.
By default, the Viz extension provides users with a startup pack that includes Prometheus, Grafana, and all necessary configurations. Just install the Helm chart and use it. It was our first choice because it saves time when you start.

During a year of usage of Linkerd, the number of workloads in our test and production environments steadily grew, and at some moment, we started to realize that dashboards work slowly. Moreover, we kept metrics values for the last hour only because a lot of memory was consumed by Prometheus (around 11GB for 500+ meshed workloads). So, we started thinking about how to make dashboards faster, spend fewer resources, and keep data for at least several days.
First attempt
Interestingly, our first wish was to keep data for a long time and use it statistically. A half year ago, Google launched their product Monarch as a managed Prometheus solution. To that moment, we had used other GCP products like Stackdriver to keep traces from Linkerd. And it was reasonable to try a new one to store and analyze time-series data with familiar tools.
The replacement of the backend was easy-peasy. We changed the container image name for test purposes and added appropriate rights to send samples to Monarch. And… It works!
In this story was a fly in the ointment. We faced two main issues. First, we could not fetch some metrics:

We resolved this issue with the Google support team. The reason for that error was the number of labels that the metric had. The managed solution had an upper limit of 55 labels. The only option to fix the issue was to reduce the count of labels and then the recreation of the metric.
We could quickly solve the first problem with the scrape config modification:
# remove this action to remove unused pod labels
- action: labelmap
  regex: __meta_kubernetes_pod_label_(.+)
  replacement: __tmp_pod_label_$1
The second problem was more tricky. By default, storing all the metrics from Linkerd requires around 1.5 million samples, costing about 9K dollars per month. It was a significant number for us, and we tried to reduce the number of samples.
As you can see on the screenshot below, we had some success in reducing the volume of ingested samples:
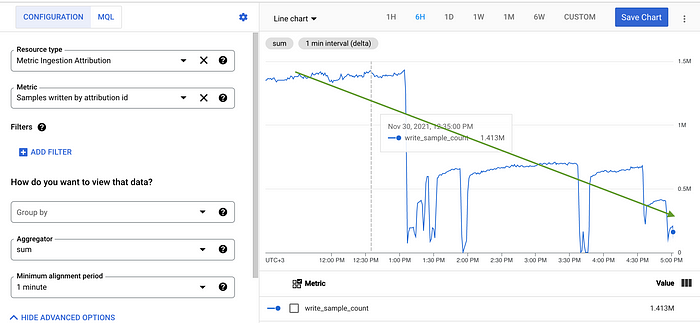
To do that, we started to export only three key metrics and doubled the scraping time from 10 to 20 sec:
# flag to export only some metrics to Monarch
--export.match='{__name__=~"response_.+"}'
It dramatically dropped the number of samples from 1.5 million to 250K. However, we lost a significant part of the metrics with such changes. And we cannot fully replace the default Prometheus installation with Monarch.
By the way, if you have additional money to spend, then Monarch will be the right choice.
Deep dive into the metrics internals
After a while, we made the second attempt to improve the dashboard performance. At that moment, we had already known about a lot of labels in metrics, and we had fixed some issues with them.
Our next step, logically, was to find out the nature of the slowness. The first thing to do was to understand the cardinality of the metrics because we hypothesized that high cardinality could significantly affect performance.
It was no surprise that Linkerd metrics (and some of them more than others) have high cardinality. The reason is simple. Most of the Linkerd proxy metrics series present the edge consisting of two POD names that are subject to change when a POD recreates. The more PODs and connections between them, the more cardinality you get.
To find the most cardinality metrics, we can use the simple query to Prometheus:
topk(10, count by (__name__)({__name__=~".+"}))This query returned that the leader is the response_latency_ms_bucket metric with more than 250K series. It was a colossal cardinality, and we should have found a way to reduce it.
Because it is the histogram metric, we observed a lot of buckets. The standard like +INF, and 1/10/100/1000/10000 ms, and additional for more precise calculation like 2/3/4/5…/40000/50000. Additional values can help achieve more accurate results in quantile diagrams, but multiple pod-to-pod edges count 25 times. The enormous number of such edges and this multiplier significantly impact Linkerd dashboard performance and stability.
The solution was to remove additional buckets from the metric:
metric_relabel_configs:
  - action: drop
    source_labels: [le]
    regex: "2.*|3.*|4.*|5.*"
It helped us to reduce the highest cardinality from 250K to 60K!
Additional Tweaks
The default Prometheus that we used (yep, we had known about the drawbacks) scrapes a lot of metrics (standard K8s, containers, Grafana, and it's own) that are not used by the Viz dashboard. We deleted all these scrapes by modifying the configuration of Prometheus. It helped us reduce the metrics volume, and Prometheus started to feel better.
Despite these changes, the performance was still average, and we started to find how we could improve it.
Because the metrics have high cardinality, we found some articles that Victoria Metrics performs better for the case. The good news is that Victoria Metrics is compatible with PromQL and supports Prometheus scrape configuration:
- args:
  - -promscrape.config.strictParse=false
  - -promscrape.config=/etc/prometheus/prometheus.yml
  - -promscrape.maxScrapeSize=256MB
  - -storageDataPath=/data
  - -retentionPeriod=30d
  - -httpListenAddr=:9090
  - -search.maxSeries=100000
  - -search.maxUniqueTimeseries=1000000
To fix the strict parse for the configuration, we removed unsupported properties:
global:
  evaluation_interval: 10srule_files:
  - /etc/prometheus/*_rules.yml
  - /etc/prometheus/*_rules.yaml
With Victoria Metrics, we achieved the monthly retention period instead of a couple of hours for the same price (CPU/MEM consumption) and significantly better performance for the Viz dashboard.
The complete scrape configuration:
Back to Monarch
Ok, now we have the operative data, but we should consider historical. Keeping all the data with all the possible metrics and edges in long-term storage is unnecessary.
We decided that there are two main metrics we want to keep as long as we can: response_latency_ms_bucket and response_total for latency and success rate calculation, respectively.
For long-term storage, we chose Monarch (presented in the first part of the article) because we planned to reduce the number of samples significantly and eliminate the high price of its usage.
Our first goal was to get rid of high cardinality labels, so we chose to create the rules to aggregate the data with valuable labels only:
We cannot use managed version because the issue with TYPE missing in the case of the federation is used, so we deployed the self-deployed version as described in the docs: https://cloud.google.com/stackdriver/docs/managed-prometheus/setup-unmanaged.
Therefore, we set up the scraping required metrics via federation from Victoria Metrics:
As you can see, we use long scrape intervals to reduce the amount of series. To export the aggregated metrics only, we limit it according to documentation and use as small as possible retention time:
containers:
  - args:
    - --config.file=/etc/prometheus/prometheus.yml
    - --storage.tsdb.path=/prometheus/data
    - --storage.tsdb.retention.time=1h
    - --web.enable-lifecycle
    - --storage.tsdb.no-lockfile
    - --web.route-prefix=/
    - --export.match={__name__=~"job:response.+:sum"}
All of this helps us to send and keep for a long-time valuable data only and pay little price for it.

As you can see in the picture above, at the moment, we ingest less than 1M samples per hour, costing us less than 100$ per month.
Conclusion
In the final solution, we divide Prometheus metrics storage for Linkerd metrics:
- short-term storage backed by Victoria Metrics for the Viz dashboard and standard Linkerd Grafana dashboards that keep data for a month
- long-term storage backed by Monarch (GCE Managed Prometheus) for historical data
Victoria Metrics helps us handle many high cardinality metrics effectively and improve the stability and performance of Linkerd observability tools. Monarch helps us to keep valuable data for a long time without a headache and for a reasonable price.
That’s the end. I hope this article helps or gives you some thoughts, insights, and fun.